4.5 KiB
Grammar of Graphics with Altair
CAPP 30239
Today
- Grammar of Graphics
- Types of Data
- Intro to Altair
Grammar of Graphics
Hadley Wickham, creator of ggplot2 and tidyverse, "A Layered Grammar of Graphics".
Key Idea: move beyond pre-defined composites like "scatter plot" and "bar chart" into a composable grammar from which we can construct a wide variety of visualizations.
Wickham's Components:
-
data and aesthetic mappings,
-
one or more layers, each with
- a geometric object (line, point, etc.)
- (optional) statistical transformation
- (optional) position adjustment
-
one scale per aesthetic mapping (color, size, etc.)
-
a coordinate system
-
facet specification
Types of Data
N - Nominal
"strings" with no order (alphabetical does not count)
Species States Countries
O - Ordered
- Grades: A, B, C, D, E, F
- Rankings: 1st, 2nd, 3rd
Types of Data (Quantitative)
Q - Interval (arbitrary zero)
- Dates (1 CE, Jan 1 1970, or...)
- Location (lat, lon)
Only differences matter, can't compare ratios. (What is 2024 / 1990?)
Temporal
Some systems (like Altair) will also offer this option specifically for dates and times.
Q - Ratio (zero fixed)
Physical measurements, counts, amounts.
"4 km is twice as far as 2 km"
Types of Data (Operations)
| =, != | <, >, <=, >= | +, - | ÷ | |
|---|---|---|---|---|
| Nominal | ✓ | |||
| Ordered | ✓ | ✓ | ||
| Interval | ✓ | ✓ | ✓ | |
| Ratio | ✓ | ✓ | ✓ | ✓ |
Data Model to N, O, Q
- string?
- bool?
- float/int?
Possible exceptions?
Data Model to N, O, Q
Typically:
- string - nominal or ordered
- bool - nominal
- float/int - interval or ratio
Possible Exceptions?
- Numeric IDs
- ZIP Codes
- ratio data stored with units (e.g. "10km")
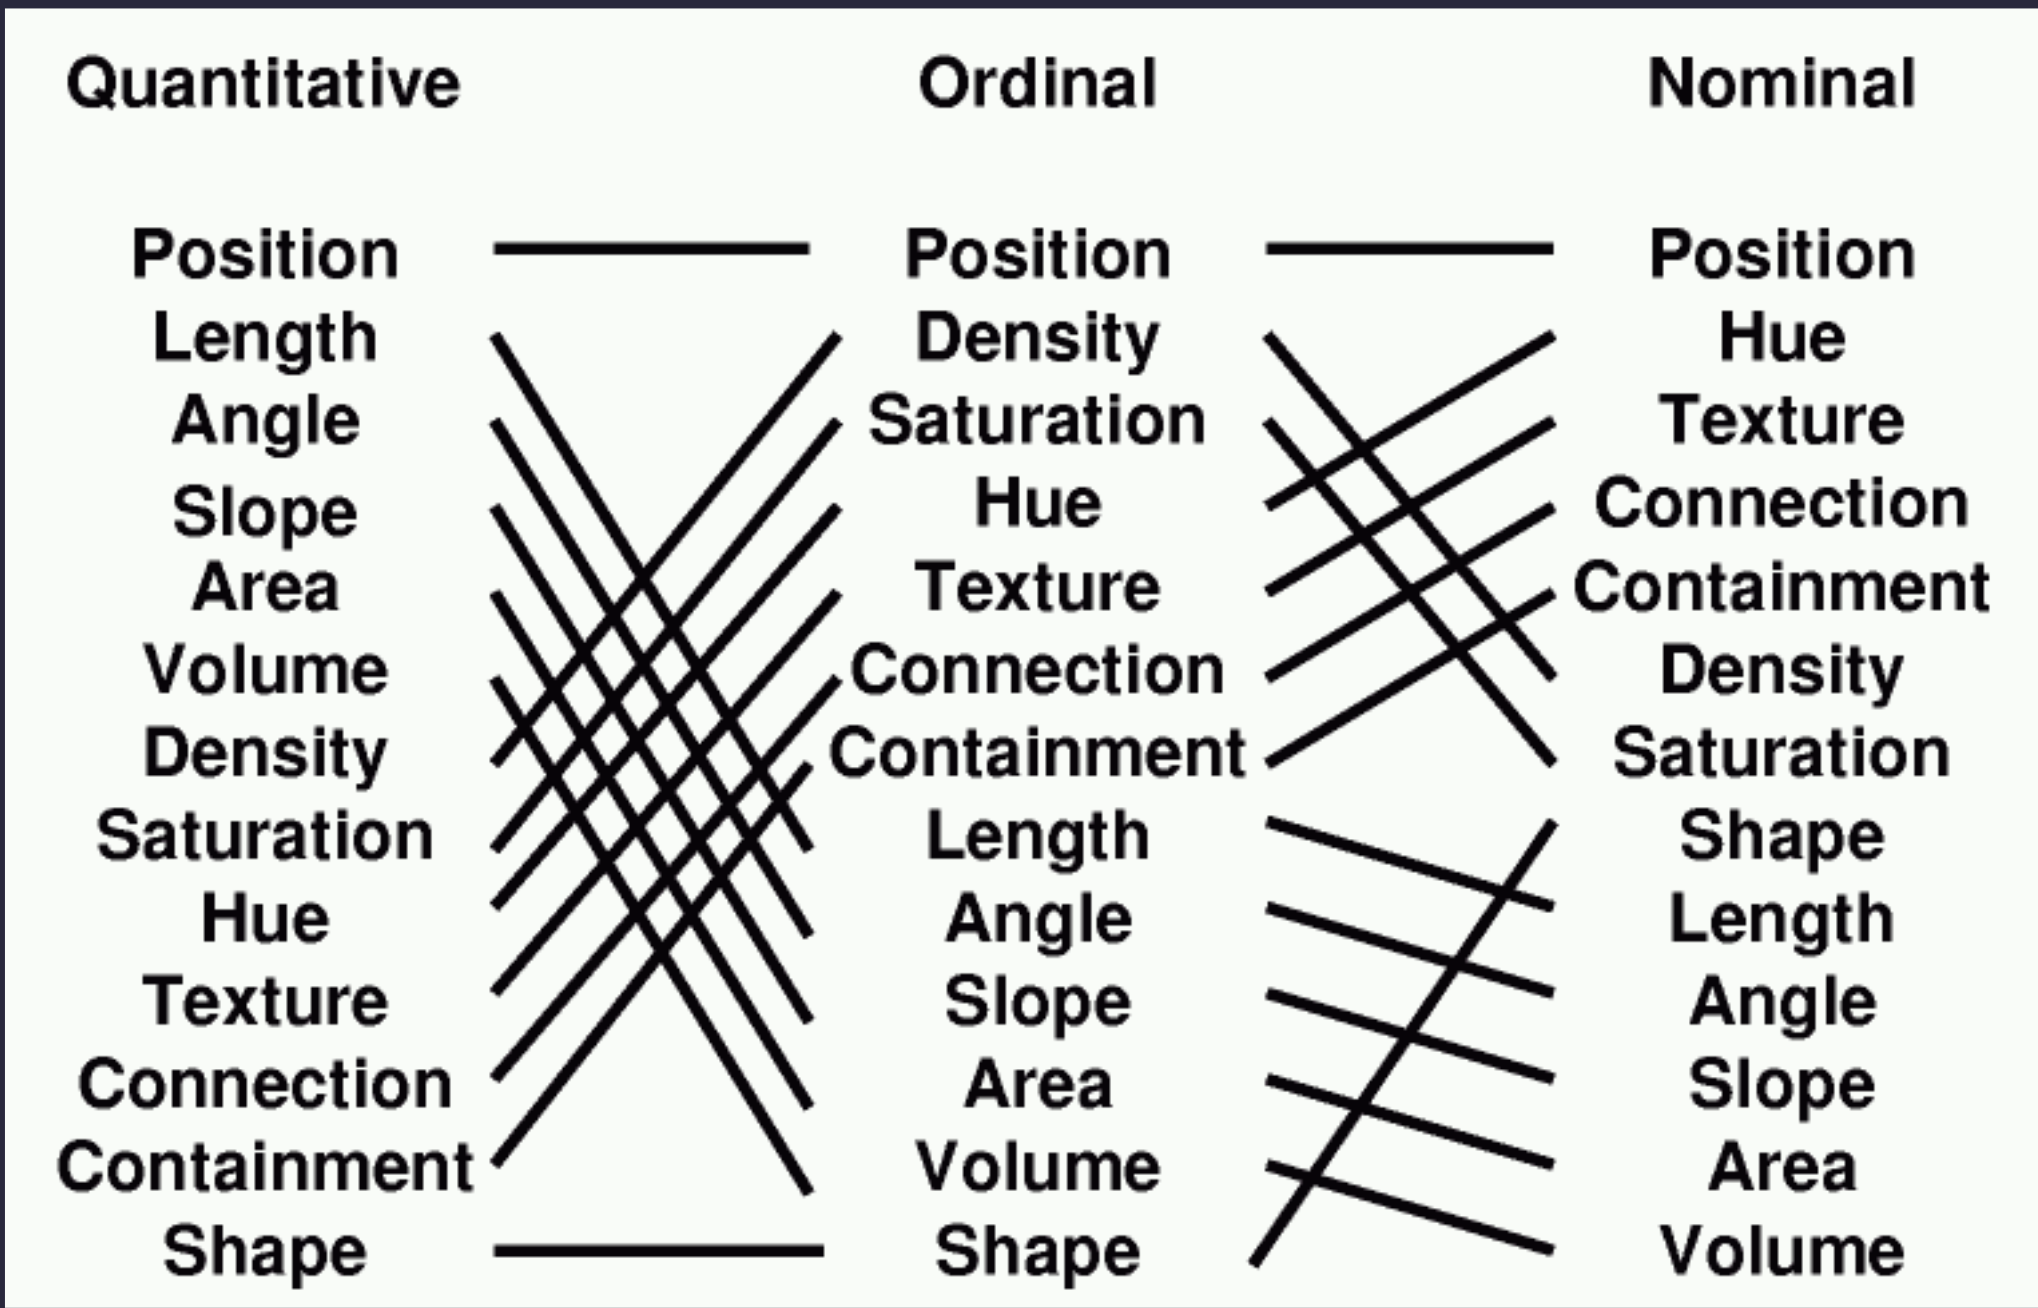
Mapping of Variables to Aesthetics
- position (X, Y, Z)
- length
- angle
- slope
- area
- volume
- density
- hue
- saturation
- texture
- connection
- containment/grouping
- shape
Mackinlay's "effectiveness"
Altair
Altair is a Python visualization library that allows us to work from a grammar of graphics perspective.
It also is very flexible in output formats, which will be useful if you want to modify your graphics or make them interactive.
Altair is built on top of Vega-Lite.
Vega-Lite is a system that represents graphics in a JSON schema, and a set of tools that convert these JSON representations to images or interactive graphics.
Vega-Lite Example
{
  "$schema": "https://vega.github.io/schema/vega-lite/v5.json",
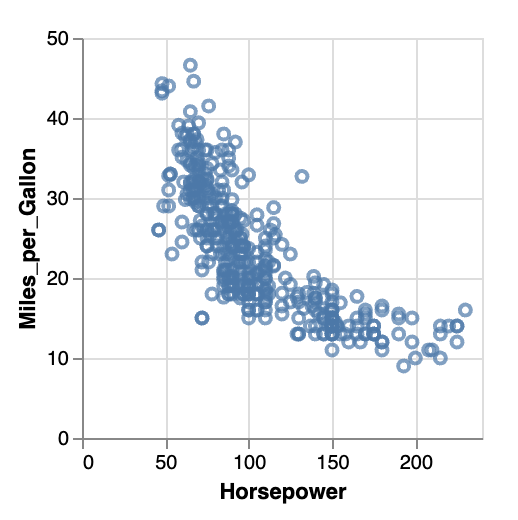
  "description": "A scatterplot showing horsepower and miles per gallons for various cars.",
  "data": {"url": "data/cars.json"},
  "mark": "point",
  "encoding": {
    "x": {"field": "Horsepower", "type": "quantitative"},
    "y": {"field": "Miles_per_Gallon", "type": "quantitative"}
  }
}
Vega condenses several of the different pieces of the grammar to "encoding channels".
Altair
import pandas as pd
import altair as alt

df = pd.read_csv("cars.csv")
alt.Chart(df).encode(
  x="Horsepower:Q",        # shorthand for simple features
  alt.Y("Miles_per_Gallon:Q").title("Miles Per Gallon"),  # longer form w/ customization
)
Altair is a Pythonic wrapper to create Vega-Lite JSON. If you use it in a notebook, the resulting graphs will render inline.
Altair Notebook
Learning Altair
To master a library like Altair, you'll go through the following phases:
- Learn the key concepts.
- Goal: Understand how the authors of Altair think about visualization.
- Achieved by: Reading user guide & watching tutorials.
- Internalize concepts & API.
- Goal: Be able to do common tasks without referring to documentation. (You'll always lean on documentation for specifics.)
- Achieved by: Working on assignments & experimentation. Reading API reference as needed.
- Mastery (not this quarter!)
- Goal: Be able to manipulate library to achieve most tasks. Understand limits.
- Achieved by: Regular use over months/years. Reading API reference and/or source code.

